Volcano Plots
Introduction
Volcano plots are used to quickly identify changes in large data sets composed of replicate data. They are therefore perfectly suited to summarizing graphically the results returned by DE analysis packages.
Volcano plots plot significance versus fold-change on the y and x axes, respectively. Thus, they combine a measure of statistical significance from a statistical test (e.g., a p or p-adj value from a DE model) with the magnitude of the change, enabling quick visual identification of those data-points (e.g. genes) that display large magnitude changes that are also statistically significant.
The statistical significance metrics used in volcano plots of gene DE is most often the p-value adjusted for multi-testing (p-adj).
Last but not least, the volcano plots provide a convenient way to show the dynamics of DE in the experiment. In other words, they show the overall magnitude of the changes in gene expression, as seen through the analysis of read count changes.
Application to the use-case PRJNA630433
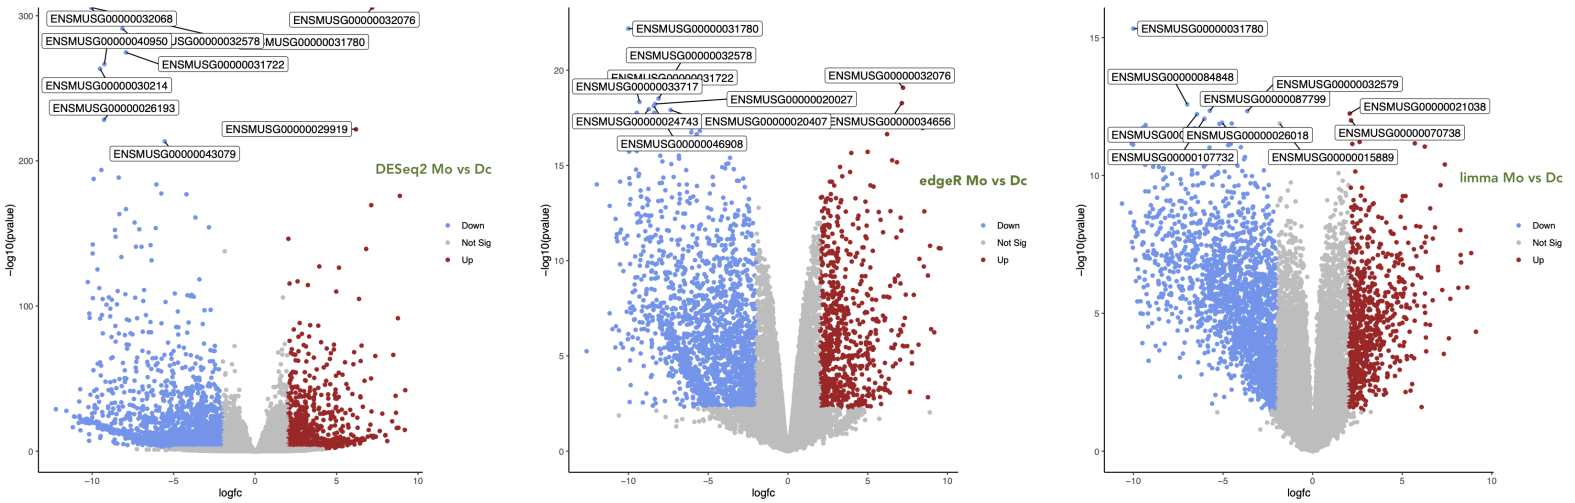
We are going to make volcano plots from the results by DESeq2, edgeR and limma-voom, respectively.
You should do it for your own analysis too !
- Thus, here, we are going to create a new
PRJNA630433 volcano plotshistory. - and copy the DE reports from the 3 histories
PRJNA630433 DESeq2 analysis,PRJNA630433 edgeR analysisandPRJNA630433 limma analysis, respectively. - Remember that for this operation, the most convenient way is to work from the
"Destination" history (
PRJNA630433 volcano plots), and to use thecopy datasetmenu, while navigating sequentially through the various "source histories" mentioned above. - Following this way, copy
DESeq2 Results TablesfromPRJNA630433 DESeq2 analysis(it is a collection of three datasets),edgeR DE tablesfromPRJNA630433 edgeR analysisandlimma on data 4, data 3, and others: DE tablesfromPRJNA630433 limma analysis.
Use of the Volcano Plot Galaxy tool for DESeq2 results
![]()
DESeq2 settings
-
Specify an input file
→ Click the collection icon and select
DESeq2 Results Tables -
File has header?
→
Yes -
FDR (adjusted P value)
If you deploy the datasets in the collection, you'll see that the P-adj is in column 7
→
Column: 7 -
P value (raw)
→
Column: 6 -
Log Fold Change
→
Column: 3 -
Labels
→
Column: 1(these are the gene names) -
Significance threshold
→ select
0.05this is only a display parameter. -
LogFC threshold to colour
→
2ie gene with a fold-change higher than 4 or lower than ¼ -
Points to label
→ select
Significant -
Only label top most significant
→ Let's take the
10most significant genes for comparison with other callers -
Plot Options
→ Just check
Label BoxeswithYes, leave the rest unchanged -
Output Options
→ Leave
Output Rscript?toNo -
Run Tool
 Rename the generated collection
 Volcano Plot on collection 4: PDF to
Volcano Plots on DESeq2 results
Repeat the same operation for edgeR and limma-voom
Be careful that the columns numbers for P-adj, P-val and log2FC may change from
one caller to the other ! You may check this by deploying the datasets in the corresponding
collections.
rename the Volcano plot collections to Volcano Plots on edgeR results and
Volcano Plots on limma results, respectively.
Comparison of DESeq2, edgeR and limma Volcano plots for the condition Mo versus Dc